September 25, 2025
Why one street trades higher than the next
In Manhattan, value often shifts at the scale of a single block. The reasons are specific and measurable: proximity to parks, landmark status, transit changes, noise patterns, zoning, flood exposure, greenery, and school zoning. Understanding these signals helps you price with confidence and avoid surprises later.
What moves value block by block
Park adjacency
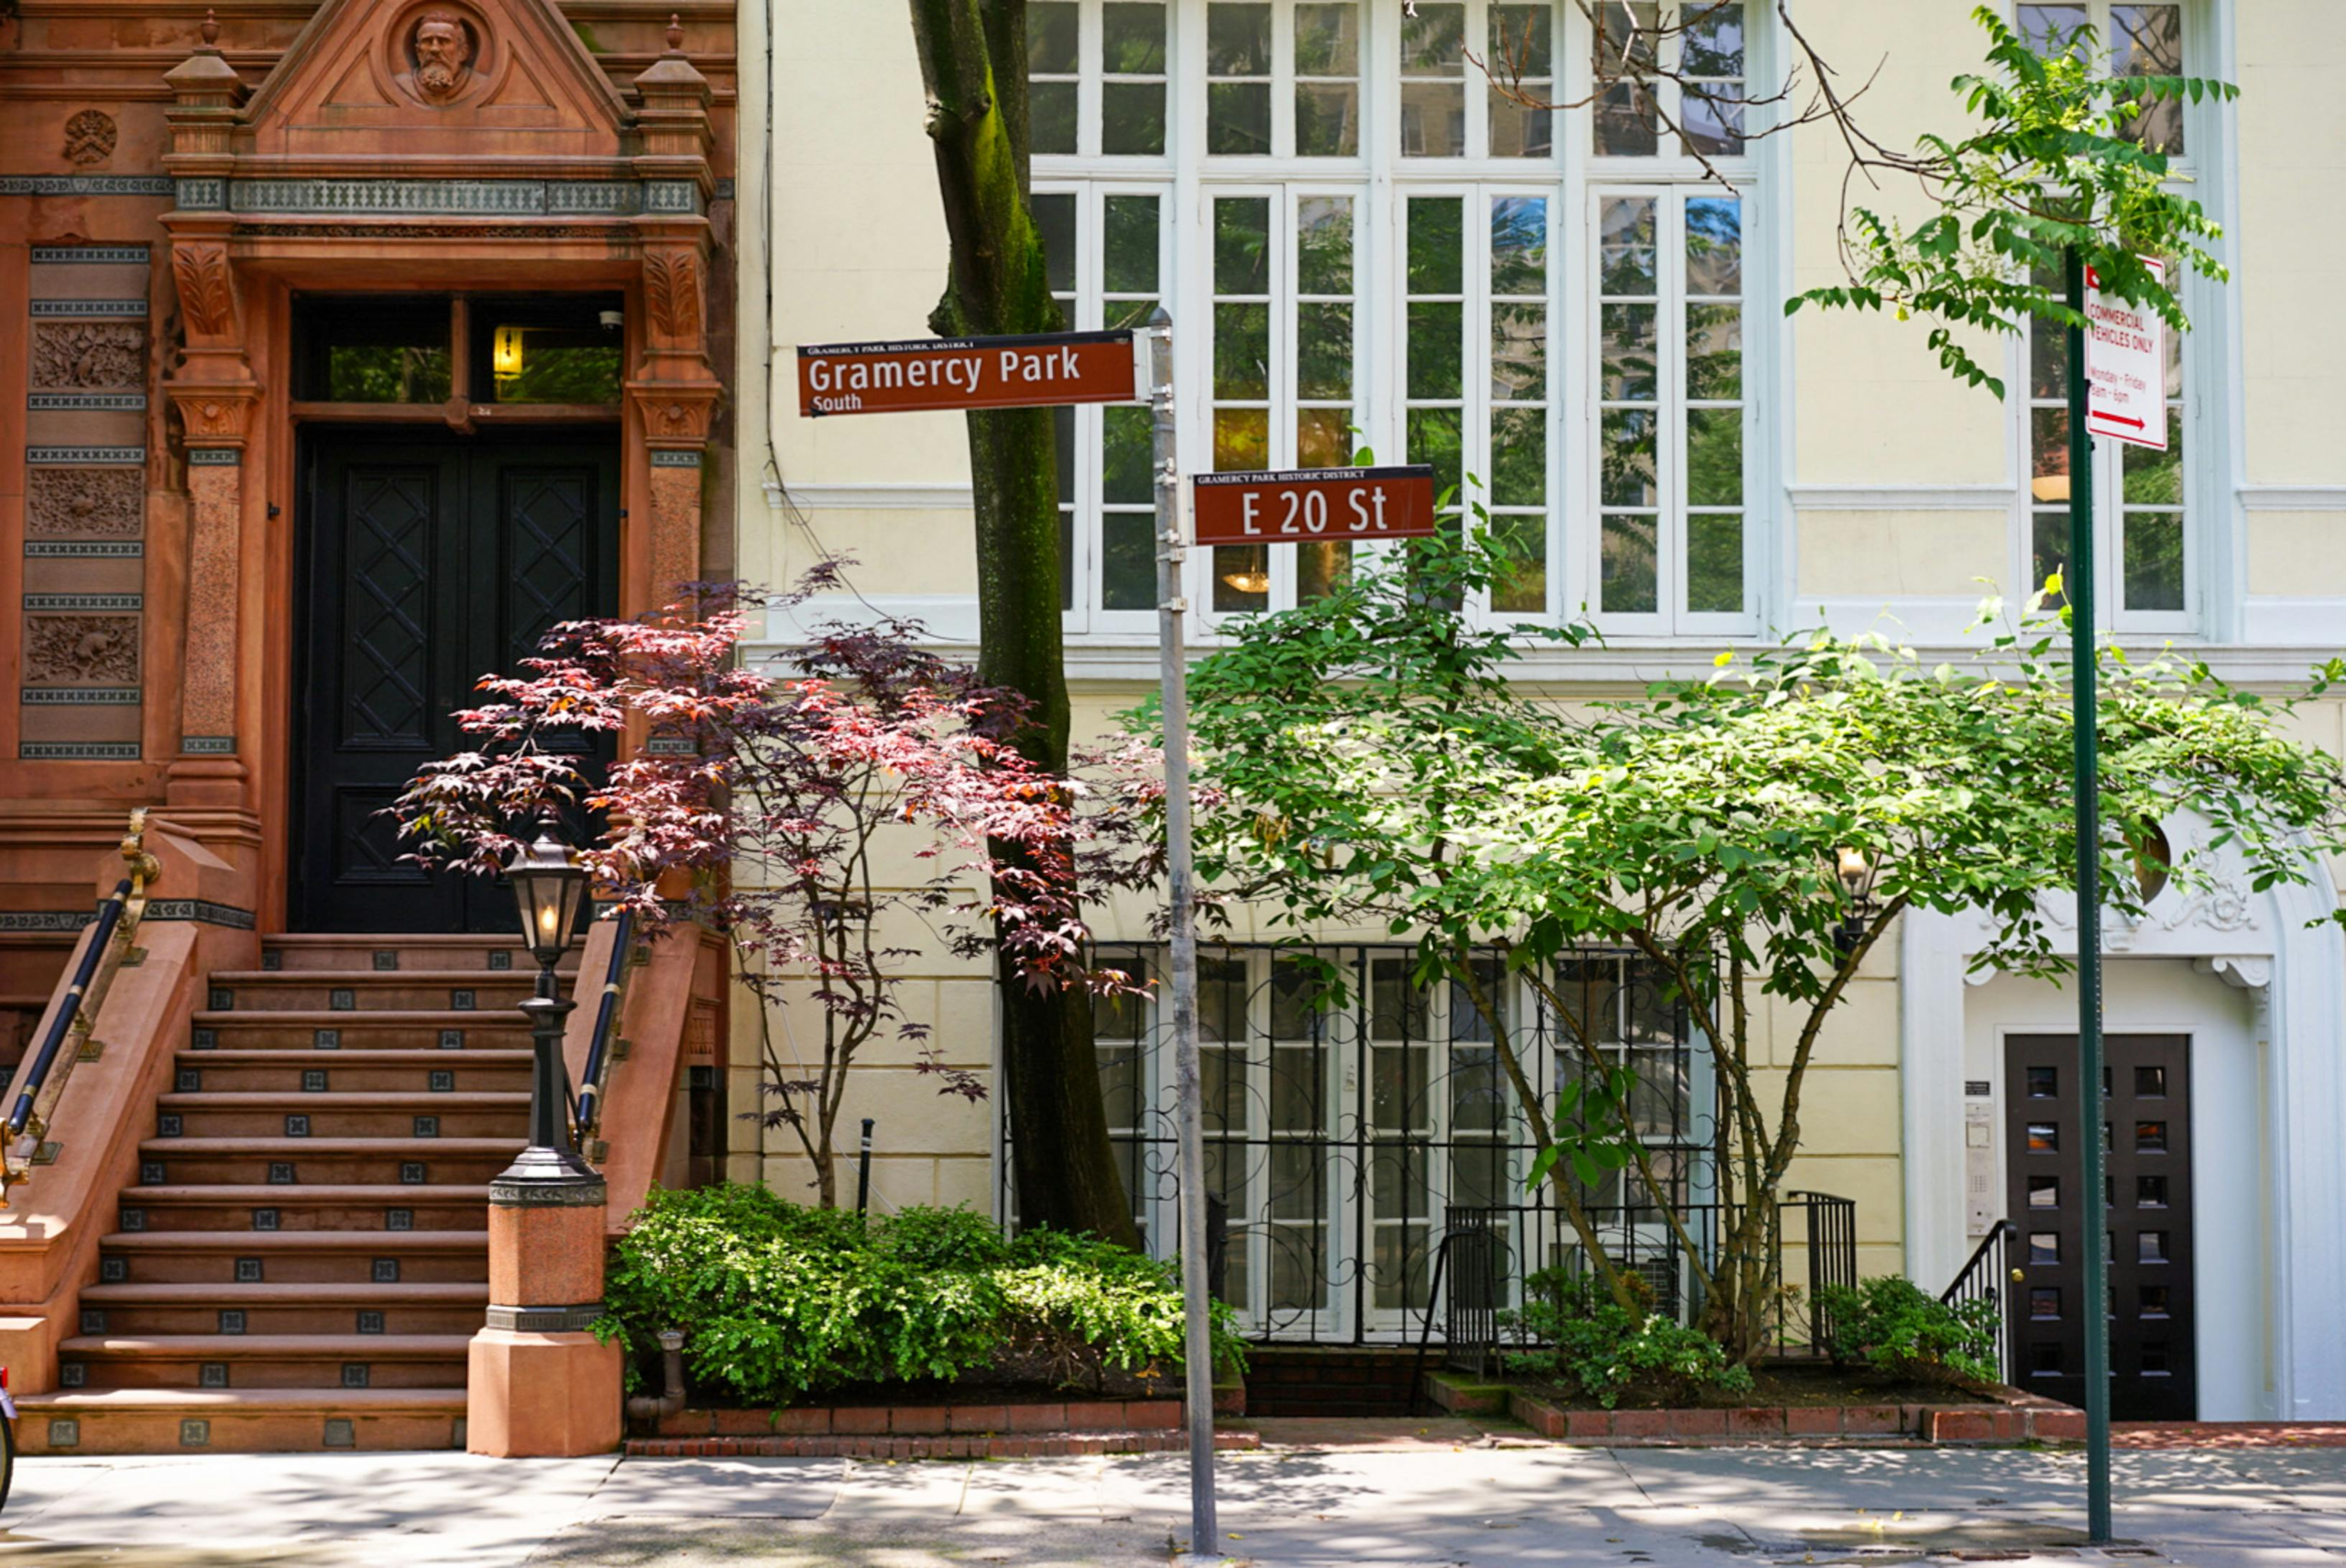
Historic districts
Transit realities
Noise and late-night activity
Zoning and the skyline above you
Flood exposure
Green on the street
School zoning
Blocks on a park or greenway tend to command more. Citywide, parks add billions in residential value, and the High Line created some of the clearest premiums in West Chelsea. Use park access as a real pricing input, not a vibe.
A home inside a New York City historic district often benefits from preservation of streetscape and consistent quality. Research from NYU’s Furman Center found higher prices inside many districts relative to nearby, similar areas. Expect renovation reviews by the Landmarks Preservation Commission, which protect character and can support long-term value.
Transit can cut two ways. Proximity and new lines reshape demand, but construction phases or certain alignments can temporarily discount nearby properties. Studies around the Q line extension show nuanced, time-dependent effects—use recent sales, not assumptions, when a subway project is in play.
Noise is the city’s top 311 complaint. Before you bid, check the 311 service request map around the block and confirm how the Noise Code is enforced for nightlife and construction. A quieter micro-zone one street over can price differently even within the same building stock.
Different residential districts (R6, R7, etc.) carry different floor-area ratios and massing rules. If a taller building is allowed across the street, future shadows, views, and street feel can change—and so can value. Verify the district and FAR before you set price expectations.
Blocks in coastal or stormwater flood zones face different insurance and resilience costs and a tighter buyer pool. Always pull the NYC Flood Hazard Mapper and FEMA layers as part of diligence. The New York Fed highlights the scale of regional flood risk—use maps, not guesses.
Tree-lined blocks and visible street-level greenery correlate with price premiums in NYC datasets. A canopy and planted streetscape are not just nice to have—they are market facts you can support with comps.
For many buyers, the public school catchment is non-negotiable. That demand concentrates value inside specific boundaries. If a building straddles a line, prices can diverge by entrance.
How to use this when you buy or sell
Pull a block map: park frontage, historic district boundaries, school zone, zoning district, and flood layers. That one page often explains price gaps better than a long comp set.
Check 311 noise density and any active construction permits nearby. Nightlife or major work can affect marketability in the next 6–12 months.
Tie micro factors to comps: compare only against homes with the same park adjacency, district status, noise profile, and zoning context.
Write it into the narrative: sellers should name the micro-advantages clearly (park block, landmark calm, tree canopy, quieter mid-block); buyers should price in the tradeoffs (future height across the street, flood insurance, late-night corridor).